Imagery details available biomass
December 5, 2014
By
Amie Silverwood
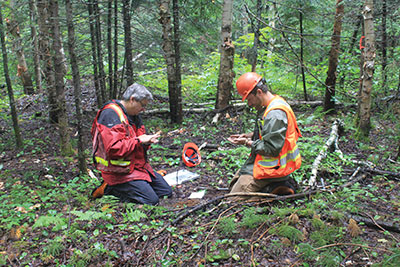
“Yellow birch, yellow birch, balsam fir,” Pat Contant, operation supervisor for Wikwemikong Department of Lands and Natural Resources, is peering through a prism as he calls out the tree species while Steve Willoughby, the manager of Sault Ste. Marie Operations for Terrafact, makes notes in his file.
“Yellow birch, yellow birch, balsam fir,” Pat Contant, operation supervisor for Wikwemikong Department of Lands and Natural Resources, is peering through a prism as he calls out the tree species while Steve Willoughby, the manager of Sault Ste. Marie Operations for Terrafact, makes notes in his file.
 |
|
| Contant and Willoughby pause to analyze the soil.
|
Terrafact is working with the First Nations group, Wiky as it is commonly called, to plot the forests and unforested areas all over the Algoma district in Ontario for the Ministry of Natural Resources. Contant and Willoughby are supervisors double-checking calibration plots “cruised” or surveyed by summer forestry student employees. The surveys will be used by photo interpreters to calibrate their understanding of what they see in the ministry’s aerial photos.
In 2008, the Ministry took to the skies to take aerial photos of the lands in the region. Different contractors have bid to take on the job of interpreting those photos – plotting out the forests by tree species, age, height and even soil samples to help the ministry inform how the province’s land is being managed.
A lab is full of forestry experts in 3D glasses analyzing the photos to determine the details of the forests plotted out in the images. The trees jut out in reds and greens and the photo interpreters can distinguish the species simply by looking at the image of the forest from above. The height is measured by scrolling their cursors up and down. There are tricks to the trade and ground surveys are one of the most important tools the interpreters have to measure the accuracy of their work.
Plotting biomass
Canadian Biomass met the two-man crew one morning in August to drive about a half hour off the Trans Canada Highway north of Sault Ste. Marie along a well-maintained regional highway that leads to a trove of cottages and a popular local ski hill. Resource roads that have been used for decades of logging branch off these cottage roadways and have become overgrown.
When the 100-year-old paper mill in Sault Ste. Marie shut down, the community’s long-standing history of forestry expertise was left rudderless. But a recent Smart Energy Strategy commissioned by the Sault Ste. Marie Innovation Centre and other community partners has provided reasons to attract biomass businesses to utilize the wood supply from Algoma forests.
“We’re trying to attract new forestry applications to our region. We have wood allocation in the area and we’re looking for new companies, new investment into our wood basket,” explains Jason Naccarato, Vice President of Development for Sault Ste. Marie Innovation Centre.
Detailed maps of the region’s forestry assets are providing the tools his centre is using to attract investment. “The companies we’re talking to now, whether they’re traditional sawmills, advanced biomaterials, or second generation ethanol or anything like that, they’re all asking the same question: ‘What’s your wood like?’ When we can come in and show them the inventory, they get more comfortable and they continue that conversation.”
Terrafact has come up with a new technology that can use super high-resolution aerial imagery and biometrics to track and manage forestry resources. The MNR’s methodology and aerial footage provide a more general overview of the vegetation across the province.
Seeing the forest for the trees
Accessibility is the largest challenge crews face when surveying a plot of forested land. Roads that were visible when aerial photos were taken in 2008 may not be passable anymore – bridges broken, washed out roads or steep hikes may greet the crews when they follow their GPS to a predetermined site.
Contant chooses a second plot when the first one turns out to be inaccessible. The second plot requires a drive down an old logging road that, despite its disuse, gives way to the truck and takes us right to the predetermined location. Crews are generally two people for safety reasons. They locate the plot using a GPS and a compass tells them which way to walk their straight line.
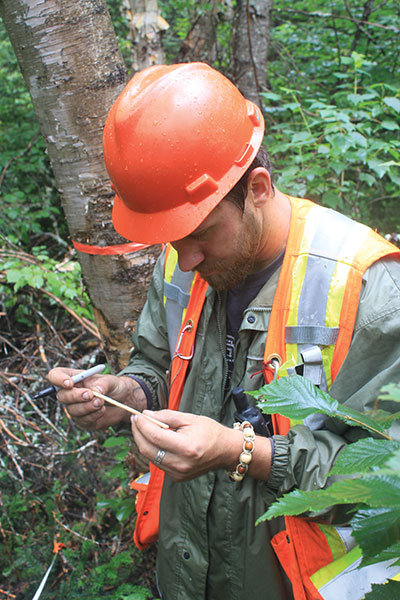
They start by measuring 10 metres from the first point and the second to tenth points are 20 metres apart. “What we’re going to do is we’re going to do a prism sweep to tally up the trees named by species, and after 10 stations, we’re going to add them all up to see what our lead species will be and our secondary. And then we’ll do three samplings of our lead species and one of our secondary. We’ll do height, age and then we’ll do a soil pit,” explains Contant. The information is then taken to the lab.
In the lab
All of Ontario is broken up into squares called Ontario Base Maps. The imagery taken by the MNR is sent to a lab where photo interpreters are able to create maps that merge the information in the images with the details collected by the cruisers like Contant and Willoughby to give an accurate overview of the province’s land.
 |
|
| Pat Contant counts the rings on a core sample of a yellow birch.
|
“The ground work is of critical importance because you use that to calibrate the rest of our calls. Some areas you might have 10 or 15 plots in one map sheet, so that’s great – you have lot of things to go on, but in my case, I don’t have any plots in my area,” explains Ben MacKay, a photo interpreter who has been working with Wikwemikong for two years. There are large areas without any roads and the interpreters don’t have a secondary source with which to verify their work.
Each interpreter is first trained as a cruiser doing surveys to get some experience on the ground. Ben started out as a forest technician with a diploma from Sault College where he learned timber cruising, mensuration skills, some silviculture and dendrology before taking a four-year forest management program from UBC.
Some tree species are easy to identify – white pines tower above the forest with a distinctive star shape when viewed from above – but others require more thought. “North facing, south facing, what type of soils are there, what other species are growing there, has there been disturbances like fire or management in the past, all those will help you make your call and describe your stand in an inventory.”
The interpreters check their work against the field crew’s data. “This orange line is the 200-metre line that you walked,” MacKay tells me. He points to a drop-down menu that has information on when that plot was last harvested or planted. “There’s a whole bunch of information for that one plot. I can see what date they did it, who the cruisers were, the species composition, and it’s nice when they put in comments as well.”
MacKay’s work joins that of the other photo interpreters in filling out a map of Ontario that can tell where deforestation or wildfire is occurring or be used to monitor the effects of climate change on forests and to develop predictions.
In the Annual Report 2014, the Ministry of Natural Resources explains the importance of gathering this type of data for the forest industry. “The more that is understood about how and why Canada’s forests are changing, the better prepared researchers and forest managers will be in adapting to all the other changes going on: in the forest products Canada turns out, in the global market demand for those products, and in the public expectations about what constitutes good forest stewardship,” the report reads.
The MNR depends on satellite imagery to map out the country’s forests and collaborate with international research partnerships to monitor global forests. But satellite imagery has not made ground- and air-based data collection unnecessary. The ministry must depend on interpreters and “boots on the ground” to verify what the satellites are seeing and provide depth and context to the imagery.
From satellites, to airplanes, and finally to the cruiser crushing the sand between two fingers, a deeper knowledge of our forests provides a comprehensive view of what’s happening in different regions. The applications for the data, however, are in the eye of the beholder.
Print this page